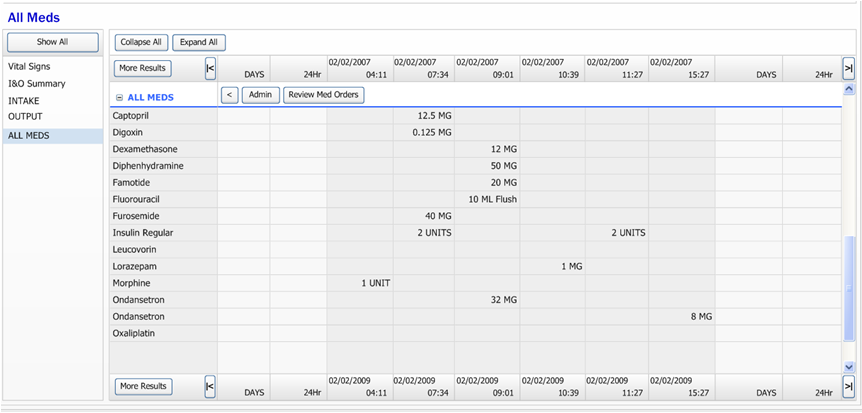
Original product
There was an existing product that displayed medication administration data. It was a grid-based view that had several critical usability issues which needed to be addressed in order to satisfy our users and increase the adoption rate. This project was to create a new solution to address these issues.
Original product
Product management simply wanted a better data grid.
I took a step back to research what exactly were the problems that needed to be solved.
I was the only product designer / human factors engineer on this project team, which also included a business analyst, clinical analyst, product manager, and development and QA teams. Most of us, including myself, were remote from across the U.S. and India.
This case study explores only a tiny fraction of the user-centered design tasks that I performed and problems that I solved on this project.
I began by interviewing our in-house nurses, doctors, and other clinicians in order to understand the history of the existing product.
Watch what the user does, not what they say
Now that I had a general understanding of the existing product, its history and issues, and some vague ideas for improvement, I went on-site with one of our in-house clinicians and performed contextual inquiry. We observed what the clinicians actually did in their work environment and how they interacted with the existing product. At unobtrusive moments, we asked what worked well, what didn't, and what they do to overcome these issues. We observed:
Having first-hand knowledge of how clinicians at several facilities work, I wrote user scenarios to clearly express what I had observed and learned, and reviewed them with clinicians and other stakeholders to validate, make adjustments, and discover new details.
I began sketching various high-level ideas for conveying the data.
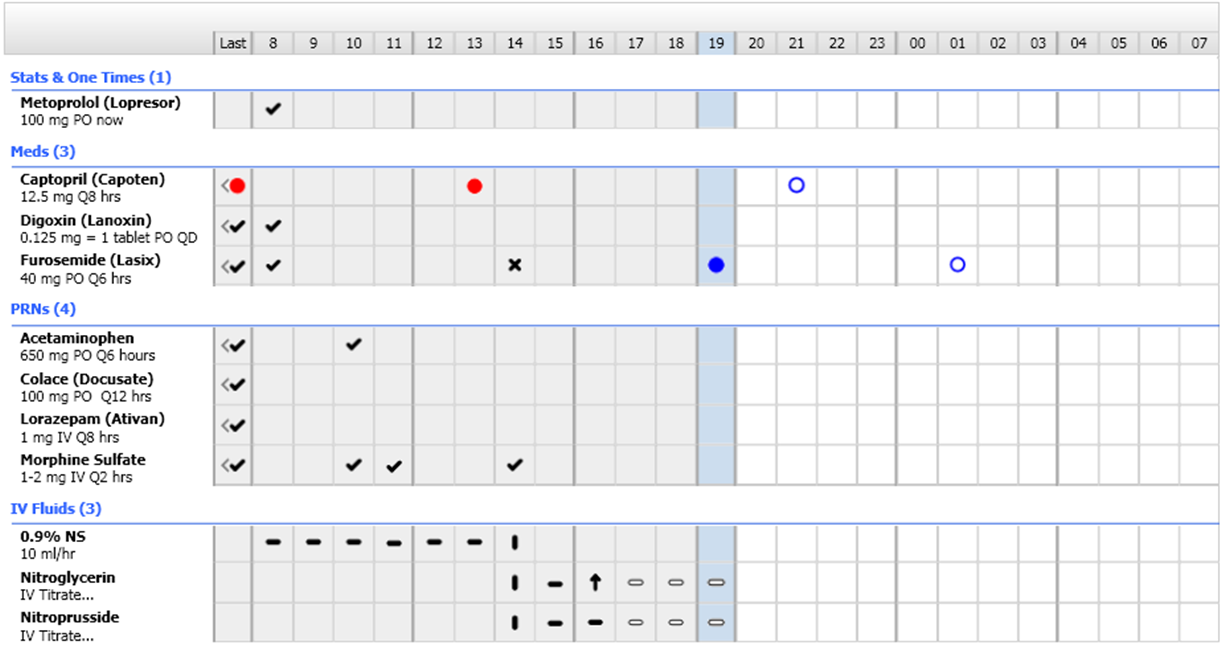
Display more hours with less details
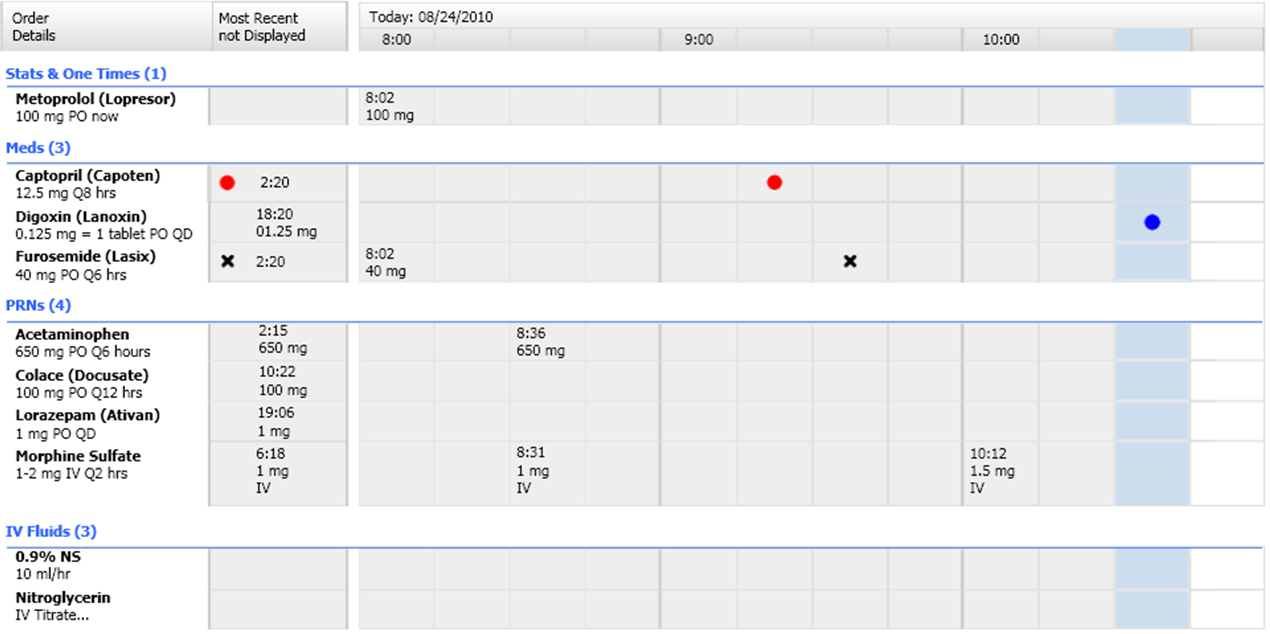
Display less hours with more details
I created wireframes to describe the overall framework and the various interactions for progressive disclosure.
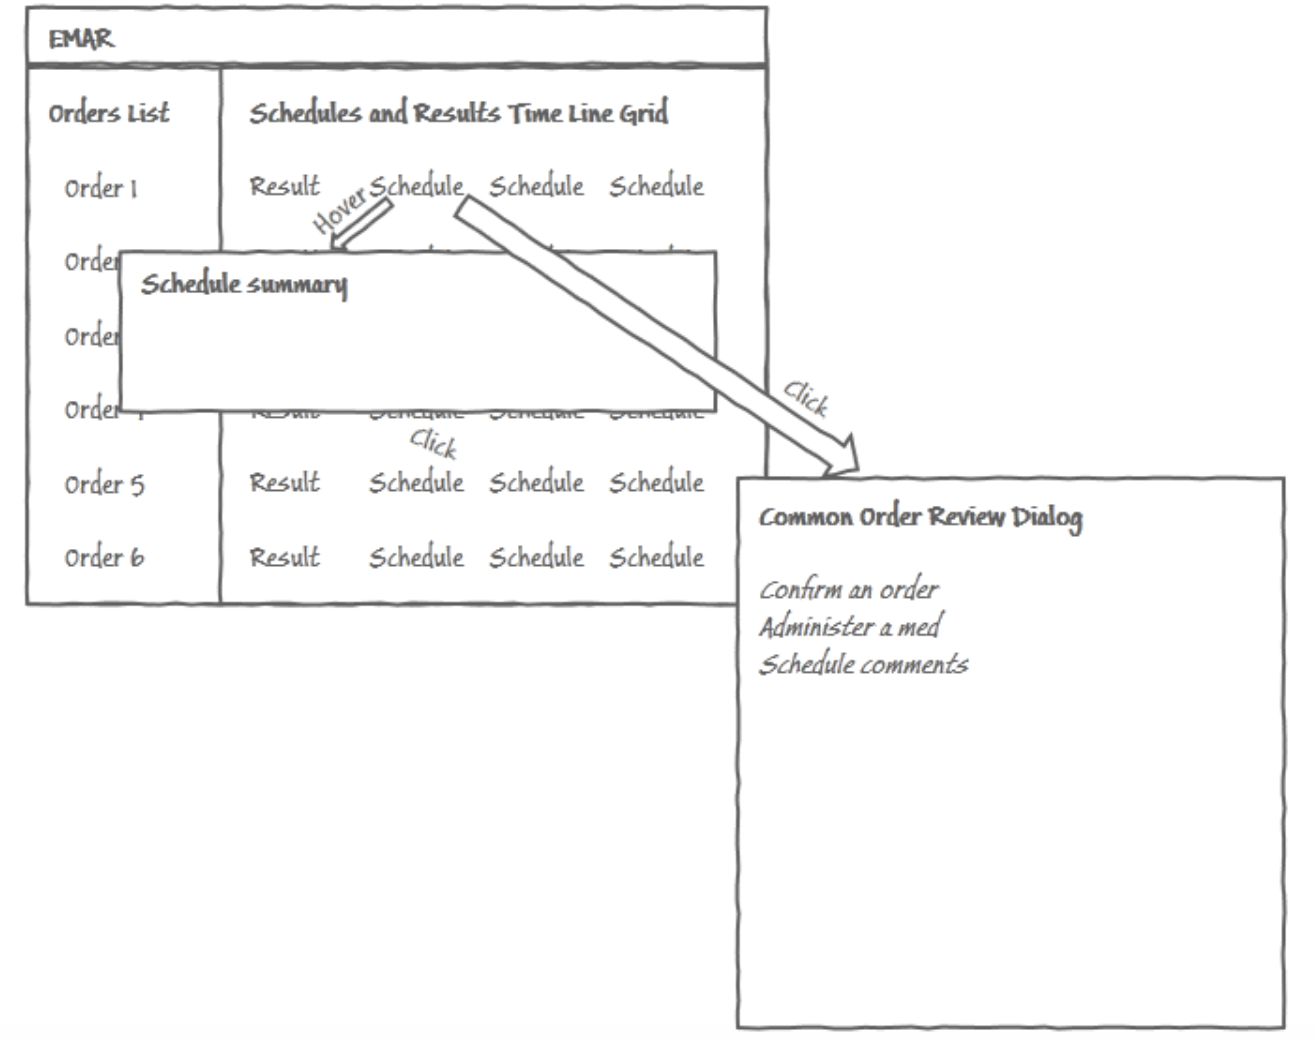
Wireframe of the overall framework
Using two views was an improvement, but I suspected that more could be done to help the clinicians. I kept thinking about my experiences as a patient and wanted to design the best tools possible for clinicians. So I began asking a whole new round of questions, this time about the data, such as, how often are medications typically administered? The answer was every four hours, or less-frequently. Therefore, more than 75% of the space would be blank.
I began to realize that a data grid wasn't the best choice for this information.
The grid was placing artificial constraints on the display. I wondered how to break out of the grid cells and take advantage of the space that is almost-always going to be blank?
With a timeline on my mind, I began tightly collaborating with the development team to explore feasibility, level-of-effort, and risk of creating a timeline display. Having worked as a senior software engineer in the past was a huge asset in the conversations, allowing us to find common understandings, and therefore find solutions that met both usability and business objectives.
As the product was being built, I continued to tightly collaborate and development and QA so that adjustments could be quickly identified and made, as necessary. With real-world business and time constraints, the final product never ends up exactly matching the original design. Brokering calculated tradeoffs is part of the job.
In all of my visual designs I continually ask myself these questions:
And hold to these principles:
I began evolving icons to use for “given”, “due”, “overdue”, “on hold”, etc. I also began exploring how to indicate current time, and the threshold of “due”. Most challenging was a defining a visual language for IVs “started”, “running”, “titrated”, “stopped”, and also “assumed to be running”.
I looked to other products for how to display all of the various types of medications such as complex medications, intermittent therapies, duration orders, etc.
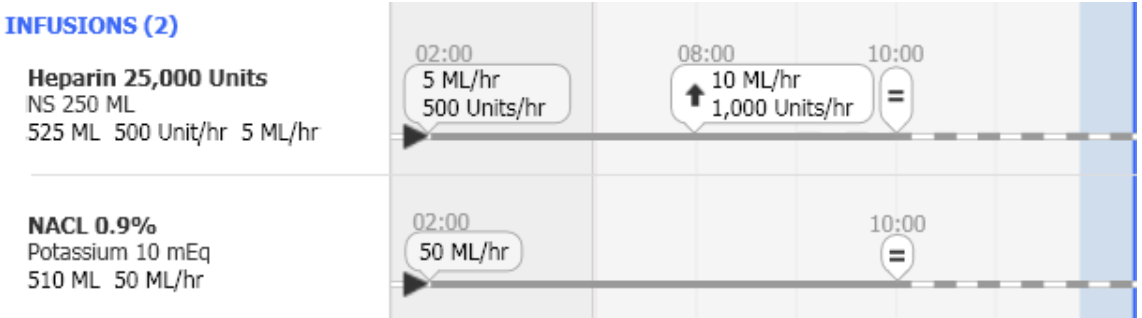
IVs on the timeline
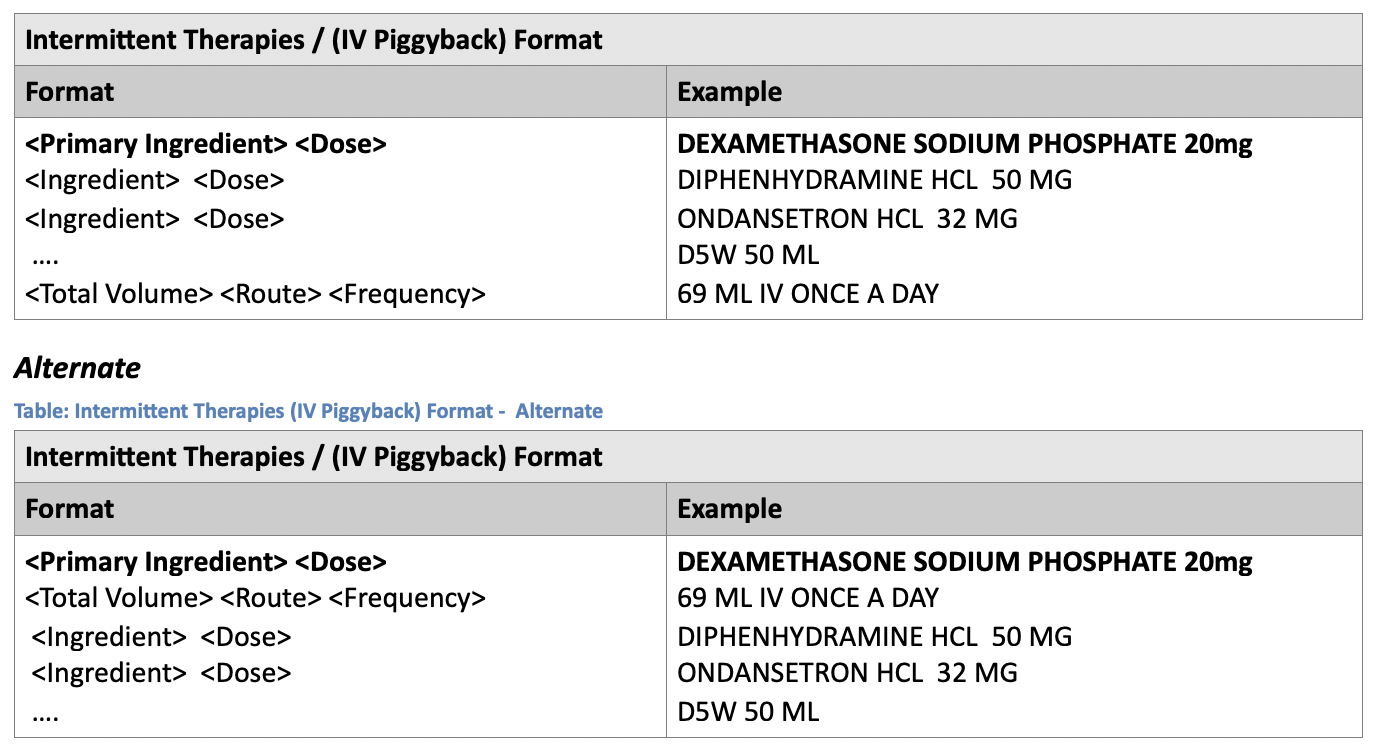
IV orders
In order to conduct usability sessions, I rapidly prototyped whatever was being evaluated. Some of the prototypes were low-fidelity, some were high-fidelity, and some were interactive. The idea is to prototype the minimum needed to get valid feedback on the specific set of criteria being investigated.
Throughout this process, I continually conducted usability sessions on the:
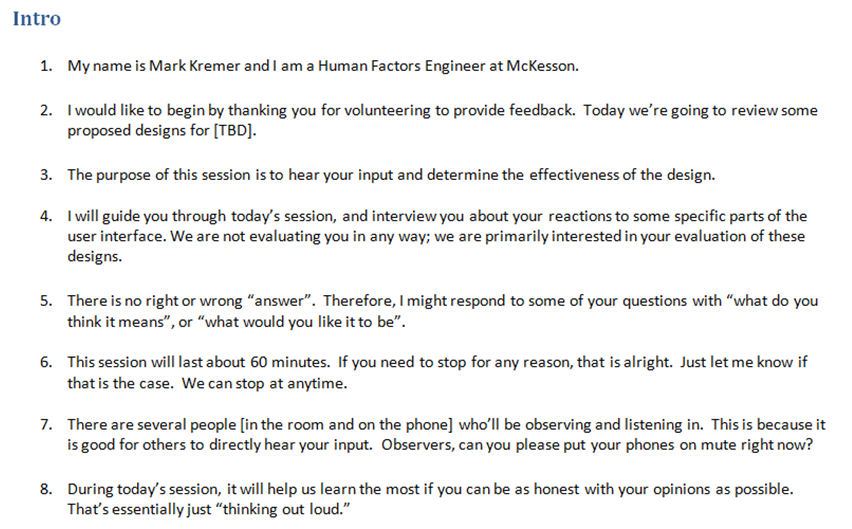
Sample usability session introduction
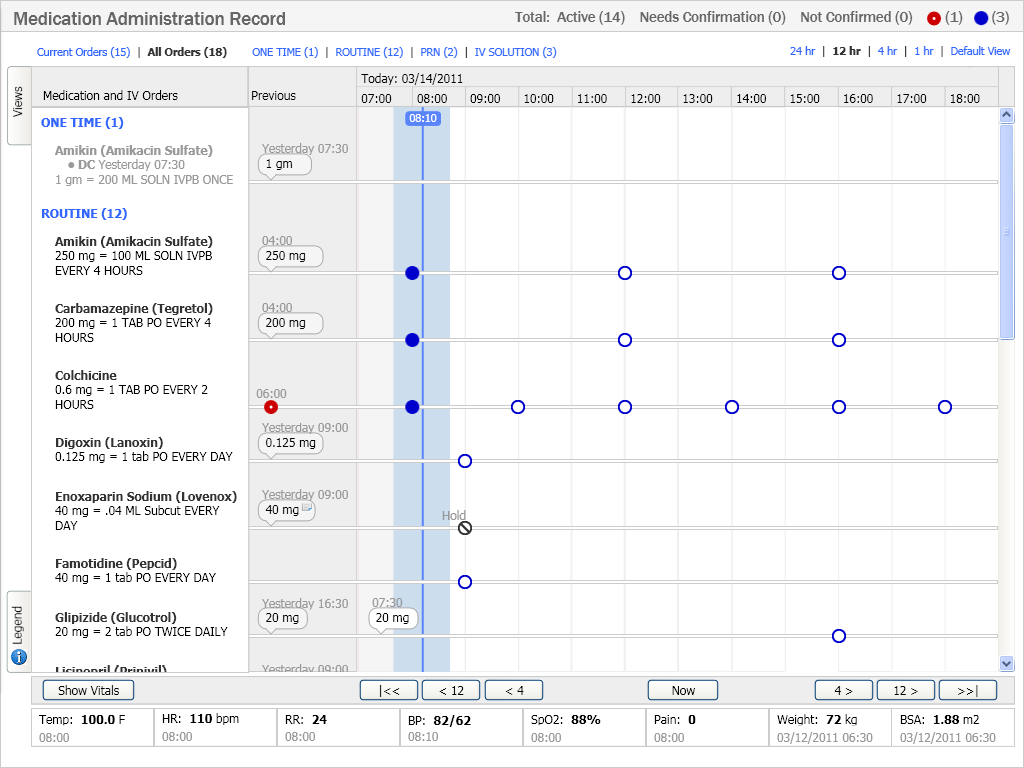
Complete Picture: A complete medication picture for a patient in a timeline. This spatial view allows the clinician to quickly and accurately scan and interpret the medication orders, schedule, and administration information.
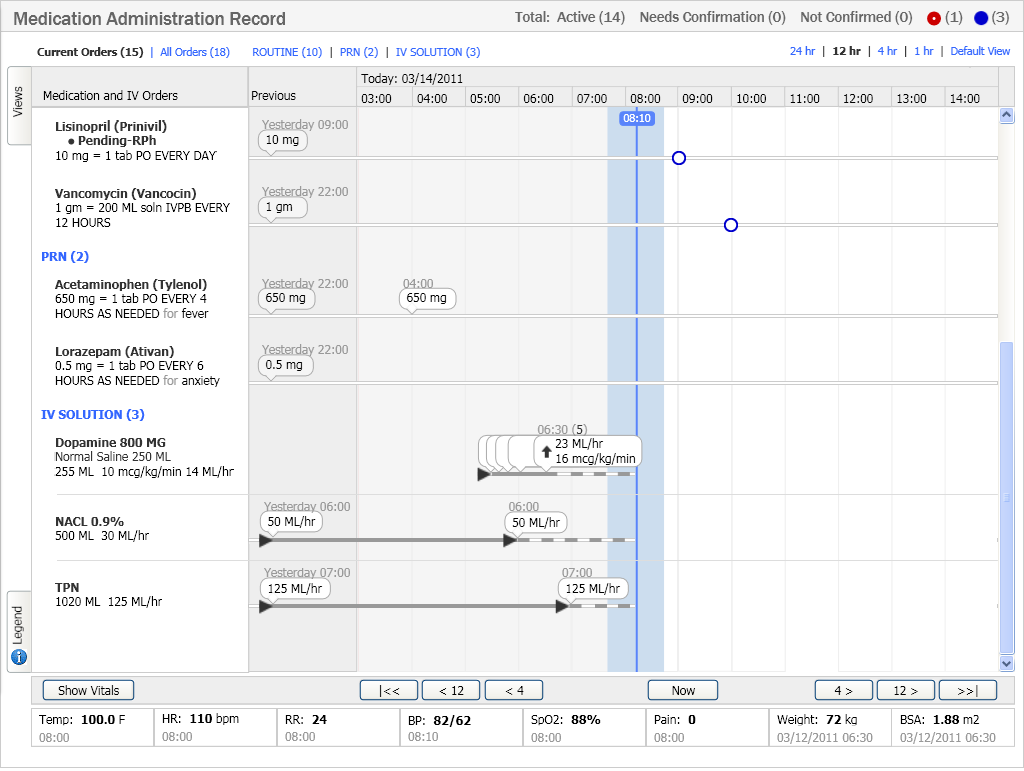
Visual Language: A lot of information is being displayed in a very compact area. This allows the clinician to quickly and accurately scan and interpret the IV order and administration information.
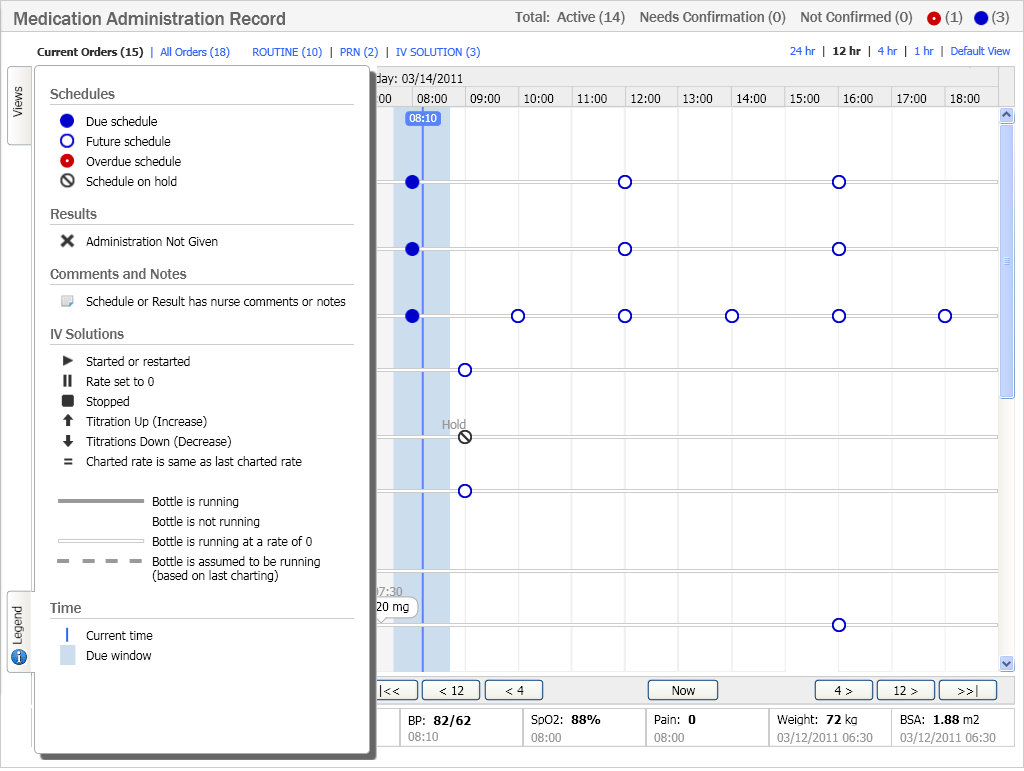
Easy to Learn: Provides quick access to a legend that allows first time users to quickly learn the meaning of every symbol. Usability testing showed that the average clinician could learn how to read this display in a few minutes, without any prior training.
Through user research, we discovered an additional need of displaying vital signs next to the medications and IV to allow for cause and affect relationships to be seen. This would be a very valuable feature that was not in the original scope. We decided a large feature like this should wait until after the initial release, thereby allowing more effective user research to be conducted using the live product.
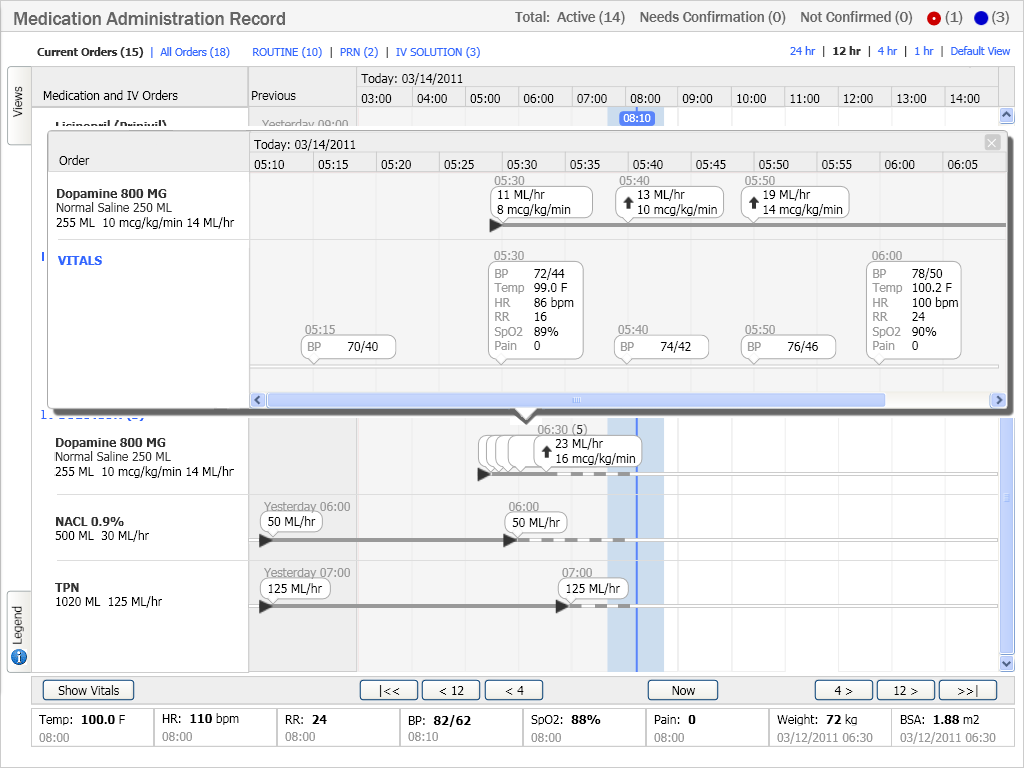
Cause and Effect: Displays cause and effect relationships among therapies and vital signs. This provides a clear view of the cause and effect relationship between an IV administration and the patient’s response.
The clinicians loved this display. No training was needed, which resulted in a much higher clinician-adoption rate
“This is one of the best examples of
Human Factors Engineering I've seen.”
Customer
There was room for improvement, notably better integration into the clinical workflow. Without the ability to administer medications directly from this view, there was an extra burden to navigate to it. While the project met all of its goals, it did not meet its full potential.
Overall, however, the clinician loved the new display and it raised the bar on how to display medication administrations. This innovative display was the result of a high-performing team working passionately towards the same goal, and was one of the favorite projects that I have been a part of.
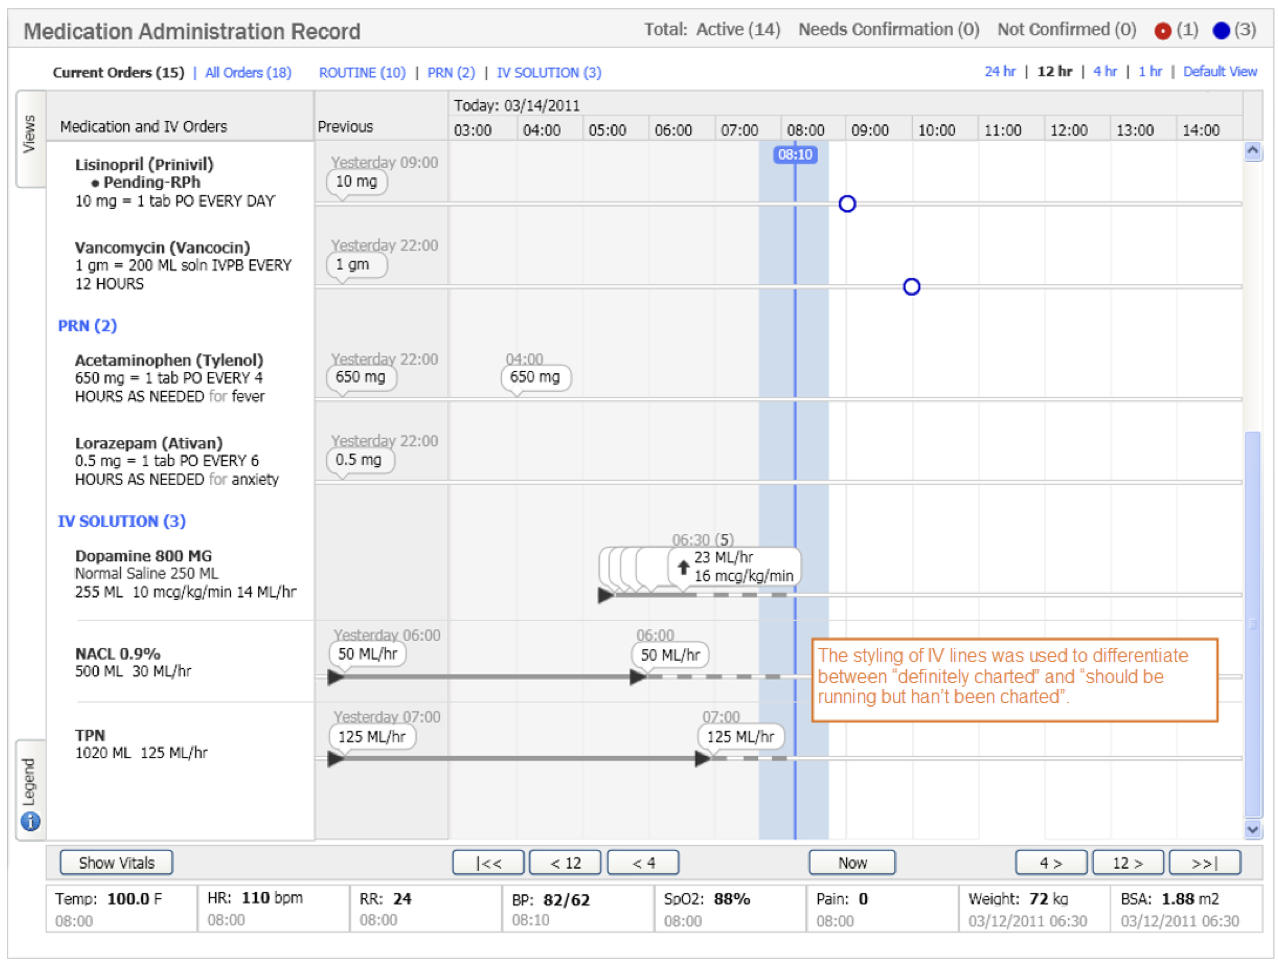
There is not a single pixel on this display that has not been thought about.
Every use of text, icons, colors, blank space, etc. was thought through and used to provide a specific meaning, with the least visual weight possible to accomplish that. Any inconsistent use of an icon, color, font, font style, or formatting of data will draw unnecessary attention to that item, and thereby slow the user down and either confuse them or lower their confidence in the application.
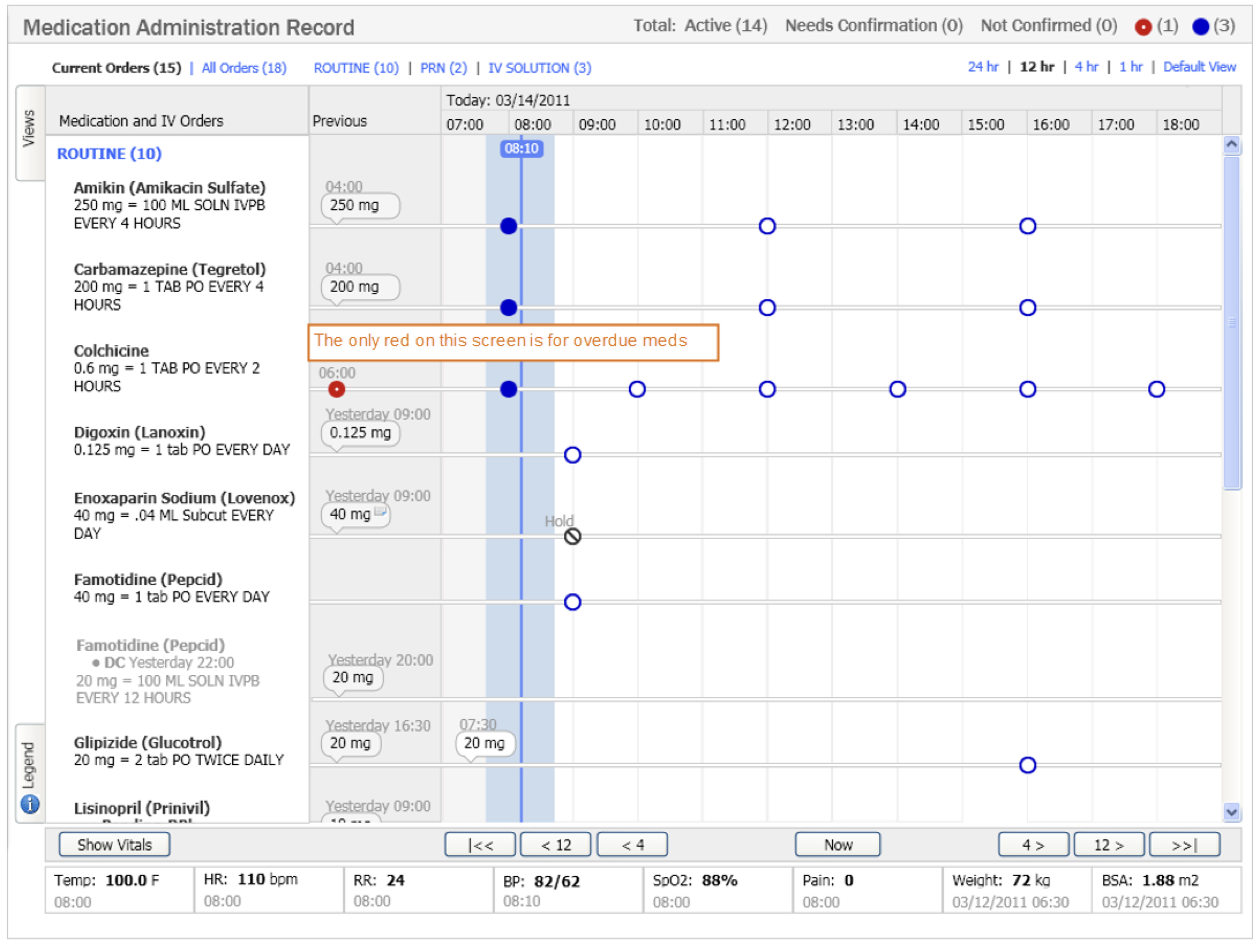
Use colors for meaning.
Red was used for top-priority alerting. A second method was used in addition to color. In this case a white dot was added to the center of the red dot.
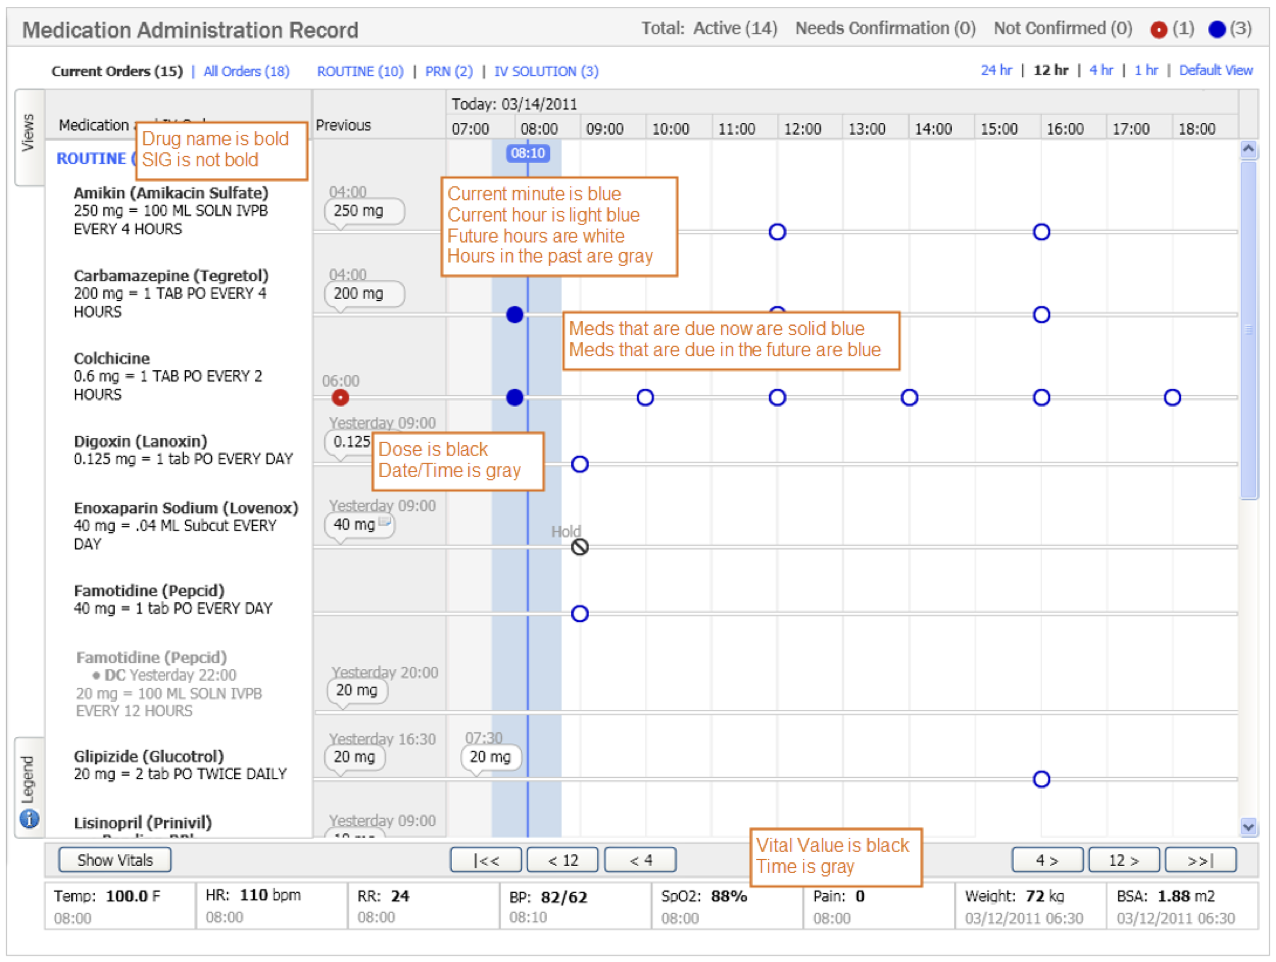
Guide the user with appropriate visual hierarchy.
A lot of usability sessions were used to understand the relative priority of the data and how to visually guide the user.
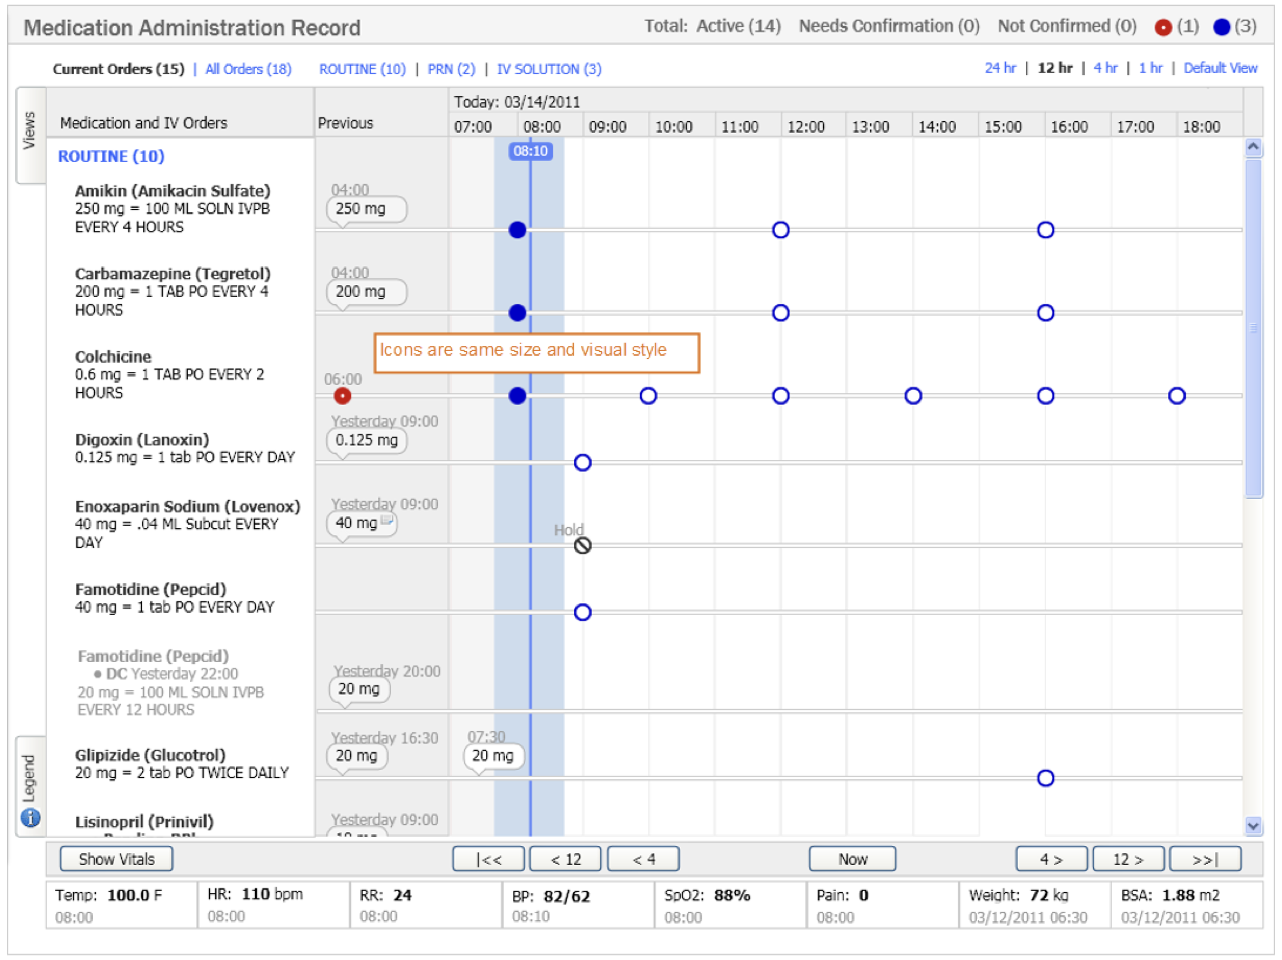
Icons are all the same size and visual style.
Icons are consistent and very simple so that they could be distinguished quickly.
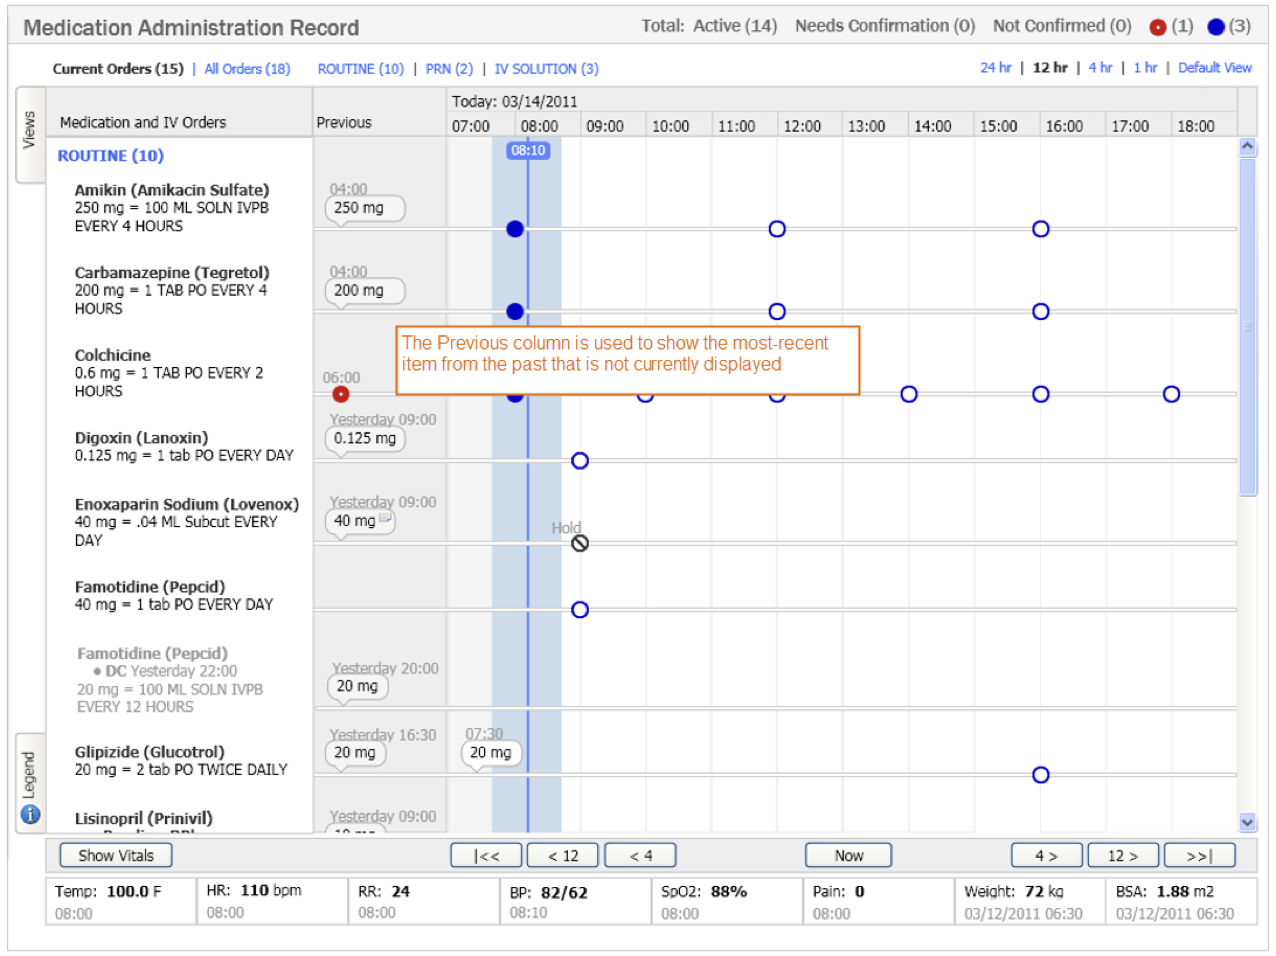
Enhancing the timeline.
Research identified the need to also see the past. I designed a column to show the most-recent information in the past, that is not in the currently displayed, about each medication.
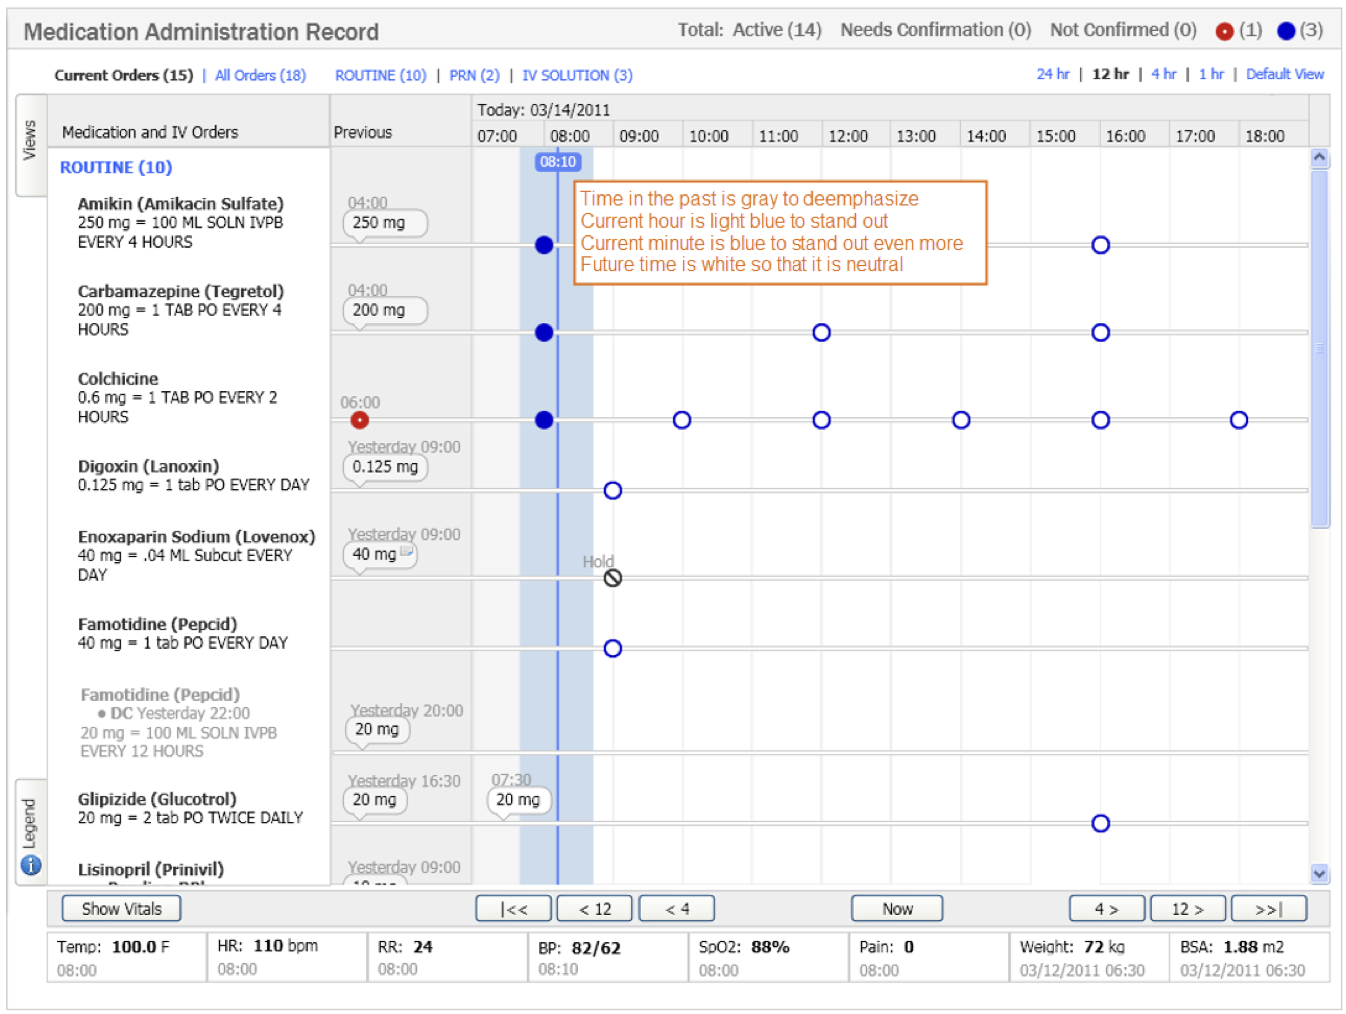
Provide guideposts to orient the user.
It is critical on complex screens to provide visual guides to orient the user.
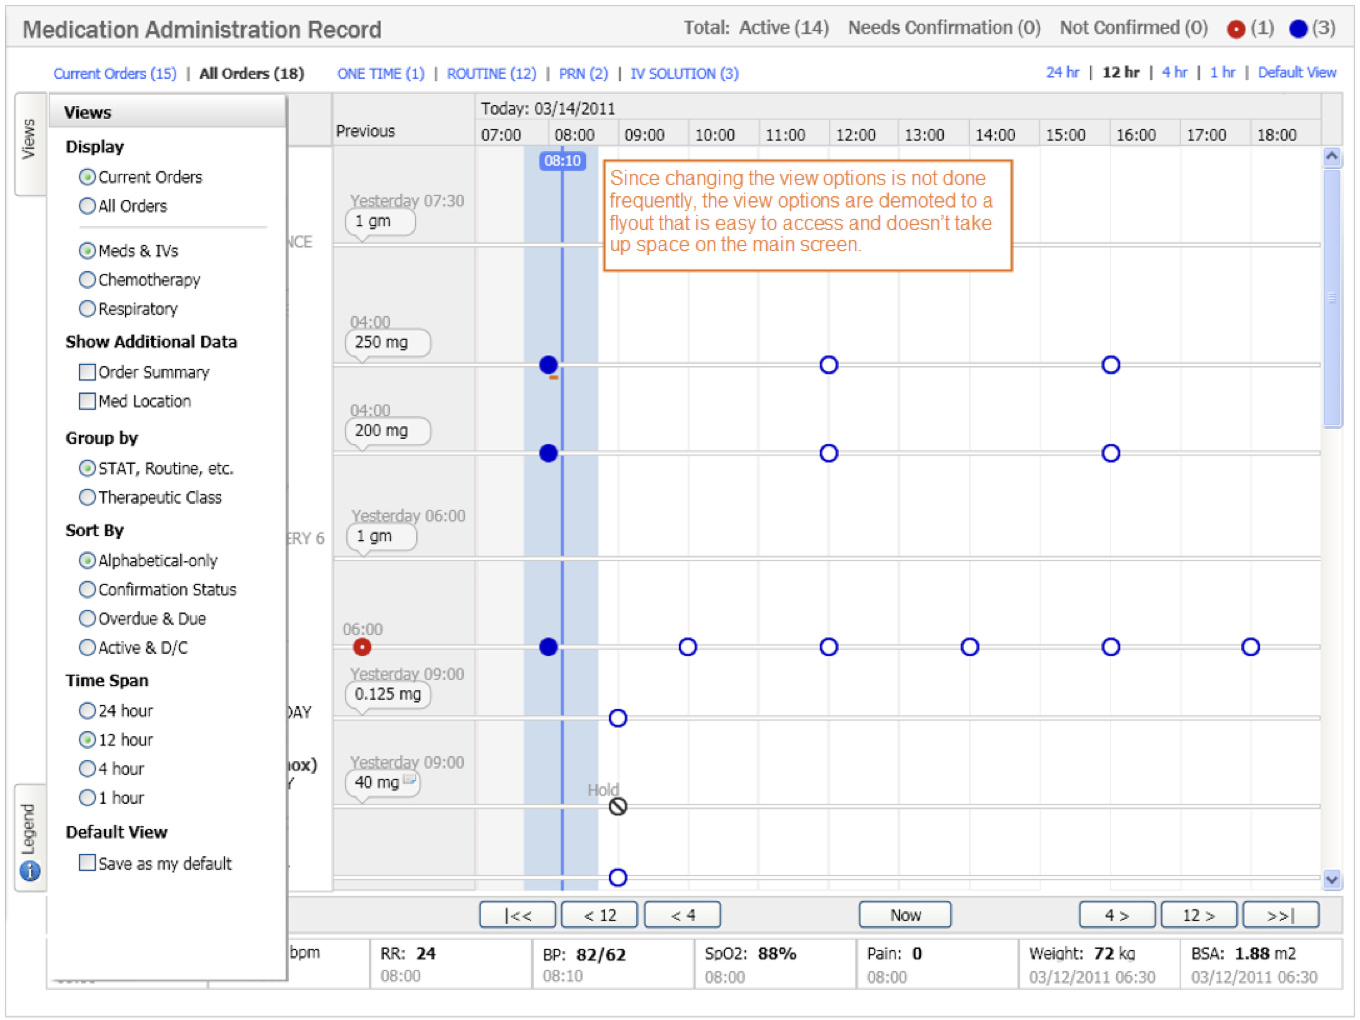
Optimize the design for the probable, but allow for the possible.
From user research, I defined the default view and with this default view, users would switch view settings infrequently. Therefore the view options were demoted to a flyout.
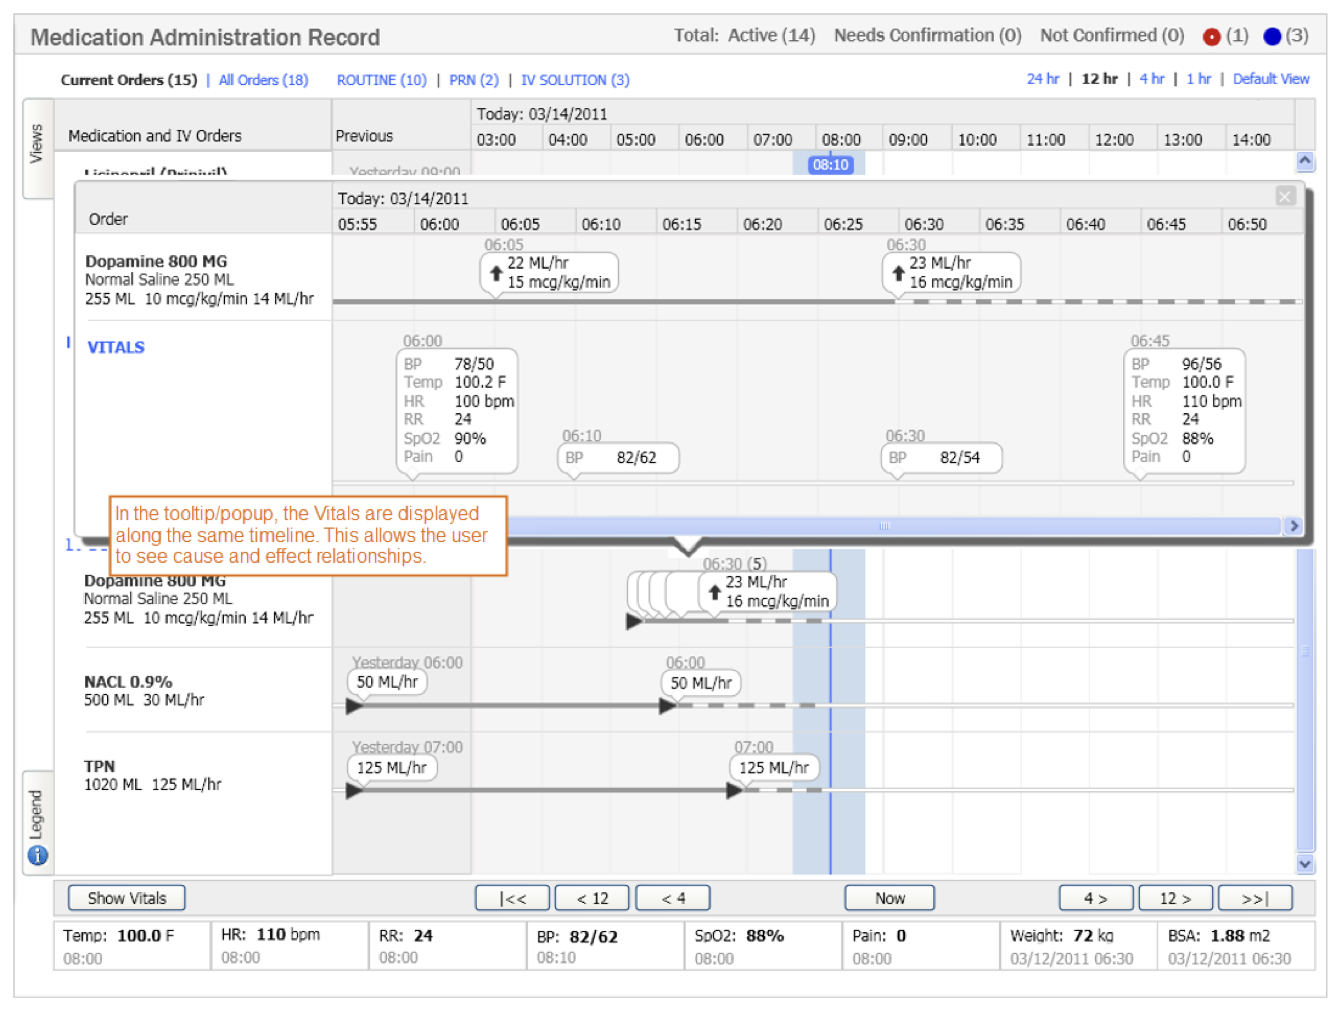
Optimize the design for the probable, but allow for the possible.
Based on user research, the most recent value is the most-important to a clinician. Therefore that is displayed on the main screen and the values in the recent past were demoted to progressive disclosure when necessary.
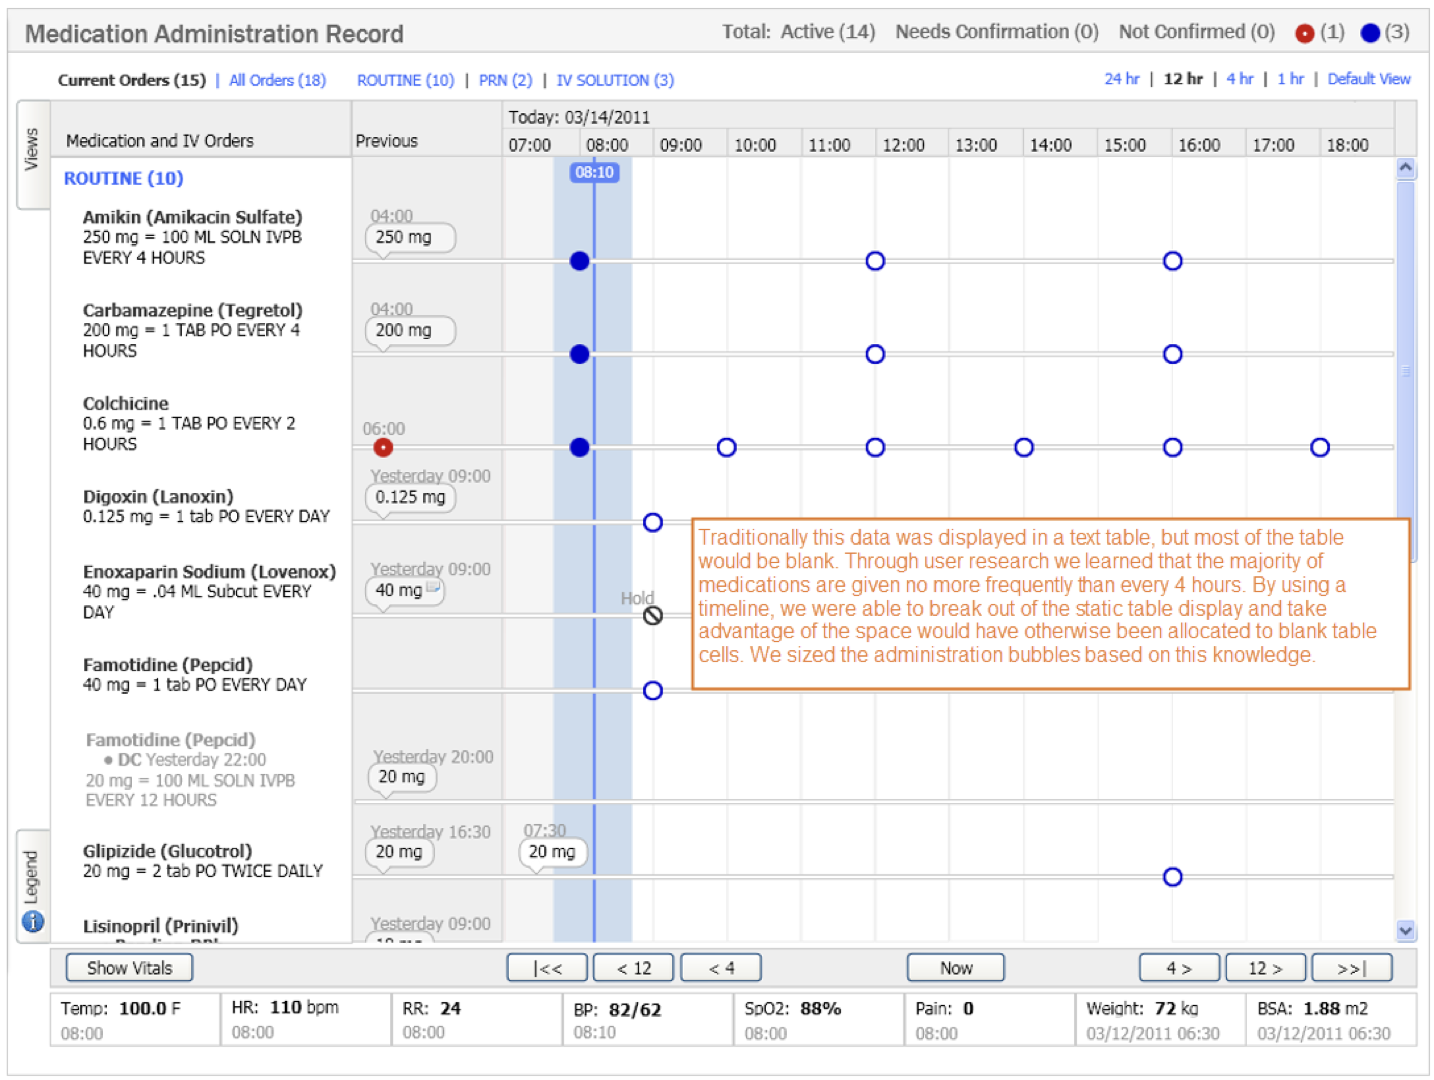
Grids are not always the optimal way to display data.
Grids are so prevalent because they are easy to code, but I have found many times where alternative views provide significant usability benefits.